where Business Intelligence & Data Science meets Formula 1
Author

#RaulGarciaMx
Raul Garcia
F1 Enthusiasts
I enjoy all about data analysis and I want to apply my data science knowledge in one of my prefer hobbies Formula 1 (As Checo says: “This is the Mexican Way”)
Tags
Telemetry Analysis for F1 Enthusiasts
Are you a fan of Formula 1 racing? Do you want to learn how to analyze telemetry data like a pro? Then our new course, 'Telemetry Analysis for F1 Enthusiasts: A FastF1 Course', is for you!
Using the FastF1 library in Python, you will learn how to download and analyze telemetry data from your favorite F1 races. Our expert instructors will guide you through the installation and setup process, as well as teach you how to use FastF1 to extract key insights from the data.
You'll explore topics such as lap time analysis, cornering analysis, and tire wear analysis, and learn how to visualize F1 telemetry data using advanced plotting techniques. With this knowledge, you'll gain a deeper understanding of the sport and be able to make more informed predictions about race outcomes.
Whether you're an F1 enthusiast, a data analyst, or just curious about telemetry analysis, this course is perfect for anyone who wants to take their understanding of the sport to the next level. Start analyzing F1 telemetry data like a pro!
Chapters:
I
Chapter I: Introduction
Medium.com
7 min read
FastF1 is a powerful Python library designed for working with Formula 1 telemetry data. With its easy-to-use interface and high-quality telemetry data,
FastF1 is an invaluable tool for engineers, data analysts, and racing enthusiasts alike. This library allows users to access and analyze telemetry data
from F1 cars, providing a detailed view of each car’s performance on the track.
In this article, we’ll explore the key features of FastF1 and how it can
be used to analyze and understand the performance of F1 cars and drivers. Whether you’re a seasoned F1 expert or just starting out, FastF1 is a must-have
tool for anyone looking to gain deeper insights into the world of Formula 1 racing
II
Chapter II: Basic Usage of FastF1
Medium.com
6 min read
FastF1 is a Python library for analyzing telemetry data from Formula One (F1) races. It provides a wide range of functionalities for working with F1 telemetry data, including loading telemetry data from files, converting data to Pandas DataFrames, and visualizing telemetry data with Matplotlib.
In this article, we will cover the basic usage of FastF1, with a focus on understanding the data structure and accessing telemetry data for a specific driver.
III
Chapter III: Visualizations & Drivers Comparison
Medium.com
5 min read
At this point we know how to get data from a specific F1 grand prix, data from drivers, data from each lap of each driver and car data. The next step is to create some visualizations and compare the performance of two drivers.
IV
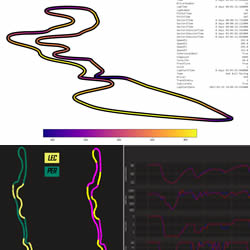
Chapter IV: Telemetry Graphic Comparison
Medium.com
4 min read
Telemetry data is also used extensively for post-race analysis, providing teams with a wealth of information on their car’s performance and the performance of their drivers. By analyzing telemetry data, teams can identify areas where a driver can improve their performance, develop strategies for future races, and evaluate new components and configurations in a controlled environment before implementing them in a race.
In this chapter we are going to compare the telemetry data of two drivers creating a plot of these variables: Speed, RPM, Gear, Throttle and Brake.
V
Chapter V: Race Strategy. (Final Chapter)
Medium.com
4 min read
The impact of stint length on race strategy is an important consideration for formula 1 teams and drivers, so we are going to create a data visualization to compare the stint length, used by each driver in a specific race.
This is the Final Chapter of this series called “Telemetry Analysis for F1 Enthusiasts”, Thanks for getting to this point.